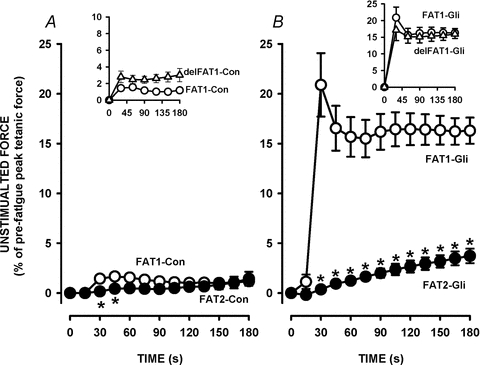
Figure 4. Increases in unstimulated force were significantly less during FAT2 than during FAT1 in the presence of 10 μm glibenclamide.

The fatigue protocols were as illustrated in Fig. 2A. FAT1 and FAT2 were elicited under control conditions (A) or in the presence of glibenclamide (B). Unstimulated force is expressed as a percentage of the pre-FAT1 tetanic force. Vertical bars represent the s.e.m. of 5 FDB bundles. *Unstimulated force significantly different from FAT1, ANOVA and LSD, P < 0.05.
