
Figure 1. Muscle-type differences in capillarization and angio-adaptive proteins.
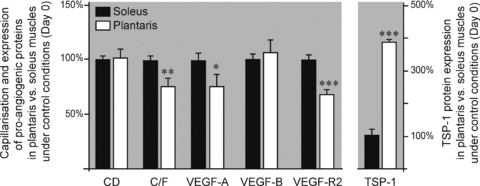
Relative levels of capillarization and angio-adaptive proteins in the plantaris muscle compared to the soleus muscle, under control conditions (i.e. day 0). Values have been normalized to soleus levels. Data are expressed as means ± s.e.m. (n = 6 rats/group). Significant difference between soleus and plantaris muscles: *P ≤ 0.05; **P ≤ 0.01; ***P ≤ 0.001.