
Figure 2. Hindlimb unloading and skeletal muscle capillarization.
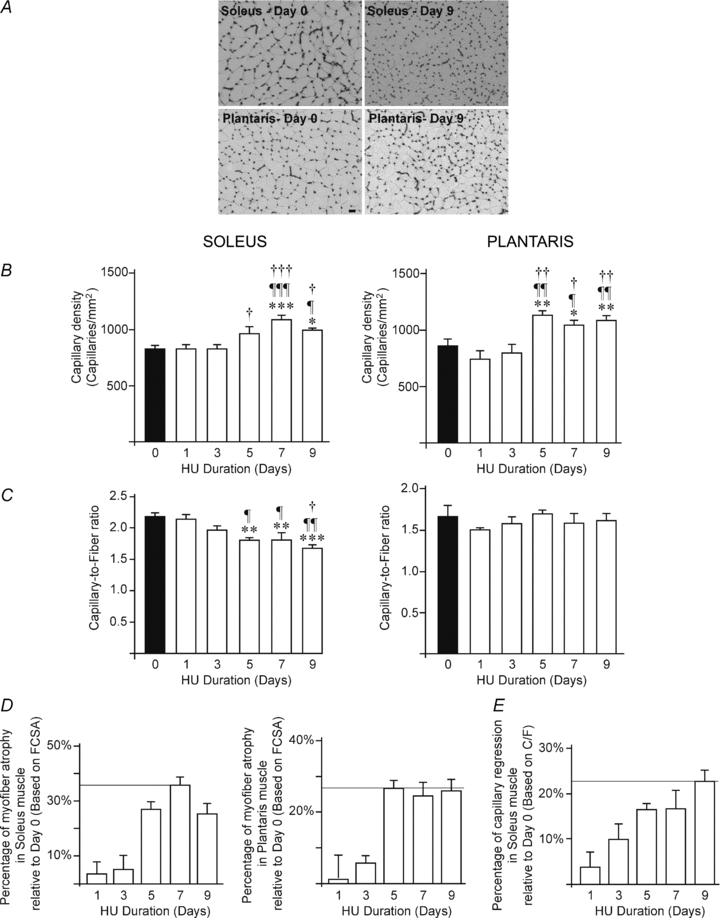
A, representative images of capillaries staining in soleus (left) and plantaris (right) muscles from control animals (day 0, top panel) and after 9 days of hindlimb unloading (day 9, bottom panel). Scale bar, 50 μm. B–C, quantitative measurement of capillary density (B) and capillary-to-fibre ratio (C) in soleus (left panel) and plantaris (right panel) muscles following time course hindlimb unloading (HU, from days 0 to 9). Data are expressed as means ± s.e.m. (n = 6 rats/group). Significantly different from day 0: *P ≤ 0.05; **P ≤ 0.01; ***P ≤ 0.001. Significantly different from day 1: ¶P ≤ 0.05; ¶¶P ≤ 0.01; ¶¶¶P ≤ 0.001. Significantly different from day 3: †P ≤ 0.05; ††P ≤ 0.01; †††P ≤ 0.001. Significantly different from day 5: #P ≤ 0.05. Percentage of muscle atrophy (D) and capillary regression (E) based on mean FCSA and C/F values, respectively. Data are expressed as means ± s.e.m. (n = 6 rats/group). FCSA, mean fibre cross-sectional area; C/F, capillary-to-fibre ratio.