
Figure 4. TSP-1, p53 and Mdm2 protein expressions in response to hindlimb unloading.
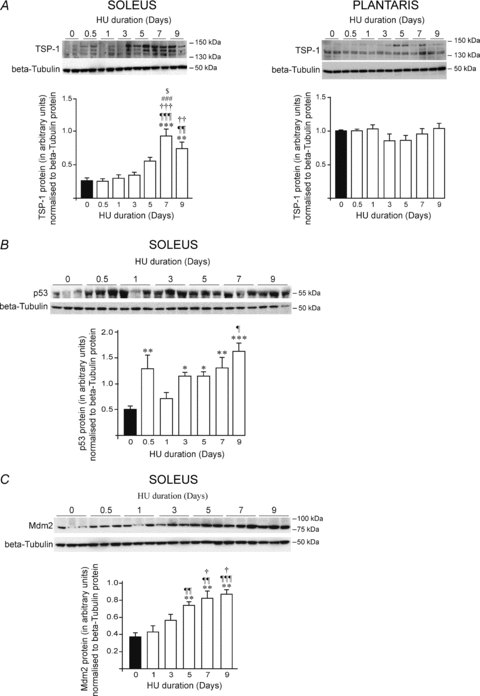
Animals were subjected to a 9 day time course hindlimb unloading. Protein levels were measured by Western blotting in soleus and plantaris muscles. β-Tubulin protein was used as a loading control. Top-panels of A, B and C show representative pictures of TSP-1, p53 and Mdm2 protein expressions, respectively. Bottom panels of A, B and C show densitometric analyses of TSP-1, p53 or Mdm2 proteins relative to β-tubulin. Data are means ± s.e.m. (n = 6 rats/group). Significant differences are vs. day 0 *P≤0.05; **P ≤ 0.01; ***P ≤ 0.001; vs. day 0.5 ¶P ≤ 0.05; ¶¶P ≤ 0.01; ¶¶¶P ≤ 0.001; vs. day 1 †P ≤ 0.05; ††P ≤ 0.01; †††P ≤ 0.001; vs. day 3 #P ≤ 0.05; ###P ≤ 0.001; and vs. day 5, $P ≤ 0.05.