
Figure 4. Glucose infusion rate is significantly higher under hyperoxic conditions.
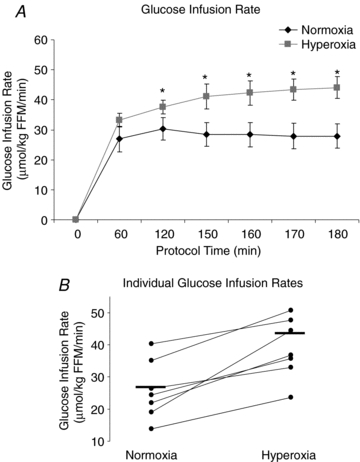
A, time course for glucose infusion rate under normoxia and hyperoxia. Normoxia: black symbols, hyperoxia: grey symbols. Values are means ± s.e.m. Significance denoted as *P < 0.05. B, glucose infusion rate at steady state during normoxia and hyperoxia for each subject. Mean values are indicated with a horizontal line. n = 7.