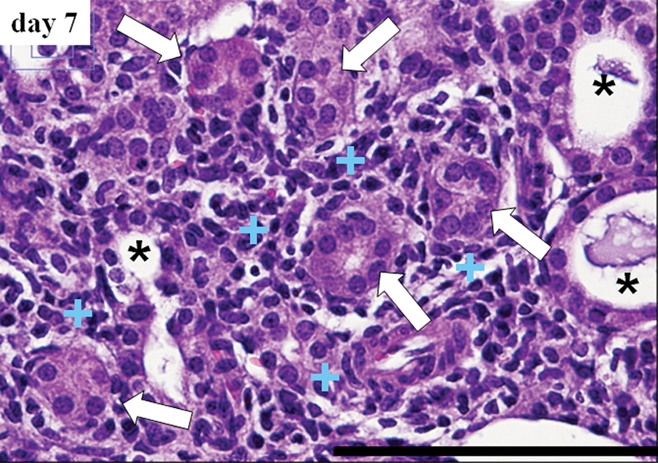
Figure 3b:

(a) Micrographs of renal cortex before UUO (day 0) and on days 3 and 7 after UUO show evolution of massive cells. (Hematoxylin-eosin stain; original magnification, ×400.) (b) A field in the day 7 sample (magnification, ×400) demonstrates morphologic changes manifested by tubular atrophy (arrows), tubular dilatation (*), and expanded interstitial space filled with numerous cells (+). Bars = 100 μm.
