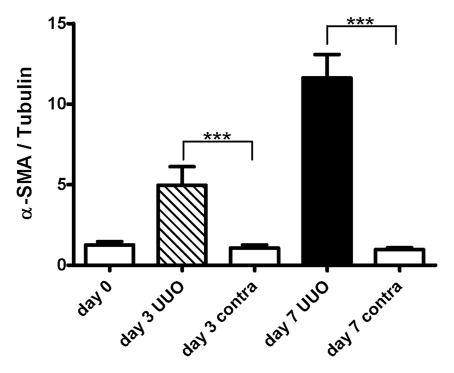
Figure 6b:
(a) Western blot analysis of α-SMA expression. Upper panels were probed with antibody that recognizes α-SMA. Lower panels were probed with antibody that recognizes tubulin, with tubulin expression used as internal control. (b) Graph illustrates mean amounts of α-SMA in kidney (α-SMA-to-tubulin expression ratios) before UUO (day 0, eight kidneys) and on days 3 (five kidneys for each side) and 7 (five kidneys for each side) after UUO. On day 0, data were obtained in both kidneys as they were intact (eight kidneys), with P < .001 (***) for comparisons of UUO and contralateral sides at unpaired two-tailed Student t testing. (c) Graph illustrates relationship between ADC and total amount of α-SMA; data indicate a strong correlation (P < .001, R2 = 0.57; simple regression analysis).

