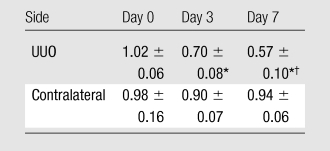
Renal Cortex ADCs before and after UUO

Note.—Data are mean ADCs (in ×10−3 mm2/sec) ± standard deviations. MR-derived ADC measurements were obtained in nine mice on day 0, in 10 mice on day 3, and in five mice on day 7.
P < .001 for comparison with day 0 value (Tukey-Kramer multiple comparison test).
P < .05 for comparison with day 3 value (Tukey-Kramer multiple comparison test).
