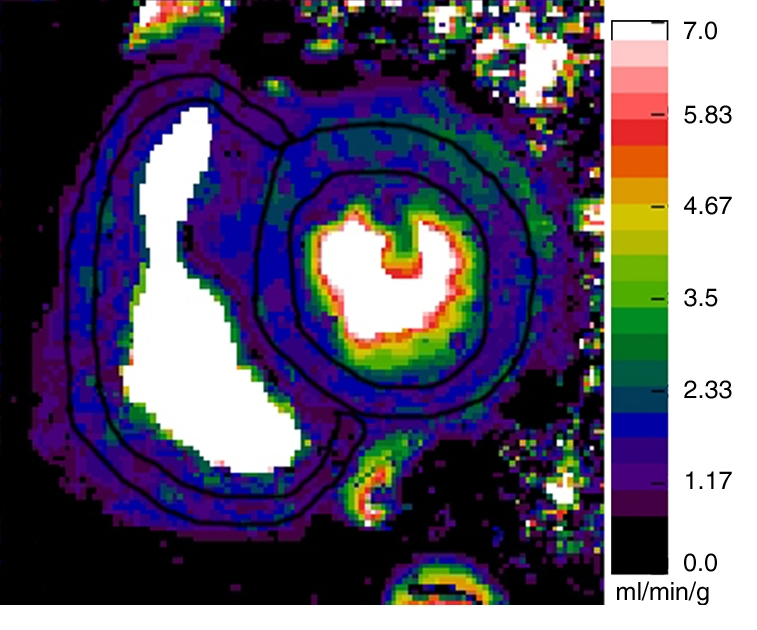
Figure 1d:

Representative short-axis perfusion maps show RV and LV regions of interest in (a, b) healthy control subject and (c, d) patient with PAH (mPAP, 45 mm Hg; pulmonary capillary wedge pressure, 10 mm Hg) at rest (a, c) and during adenosine-induced stress (b, d). Perfusion scales are at right. There were significantly lower RV and LV myocardial perfusion reserve indexes (MPRIs) in the PAH group than in the healthy control group (Table 1). Also note the RV remodeling in c and d.
