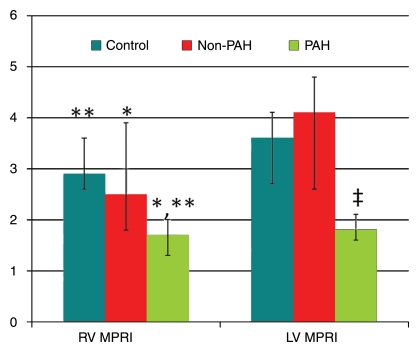
Figure 2:
Graph illustrates median values (with 25th and 75th percentile error bars) of RV and LV MPRIs (y-axis) in control, non-PAH, and PAH groups. P < .05 (*) and P < .01 (**, ‡) for comparisons of PAH group with control and non-PAH groups. There were no significant differences in LV MPRI (P = .48) or RV MPRI (P = .31) between the control and non-PAH groups.

