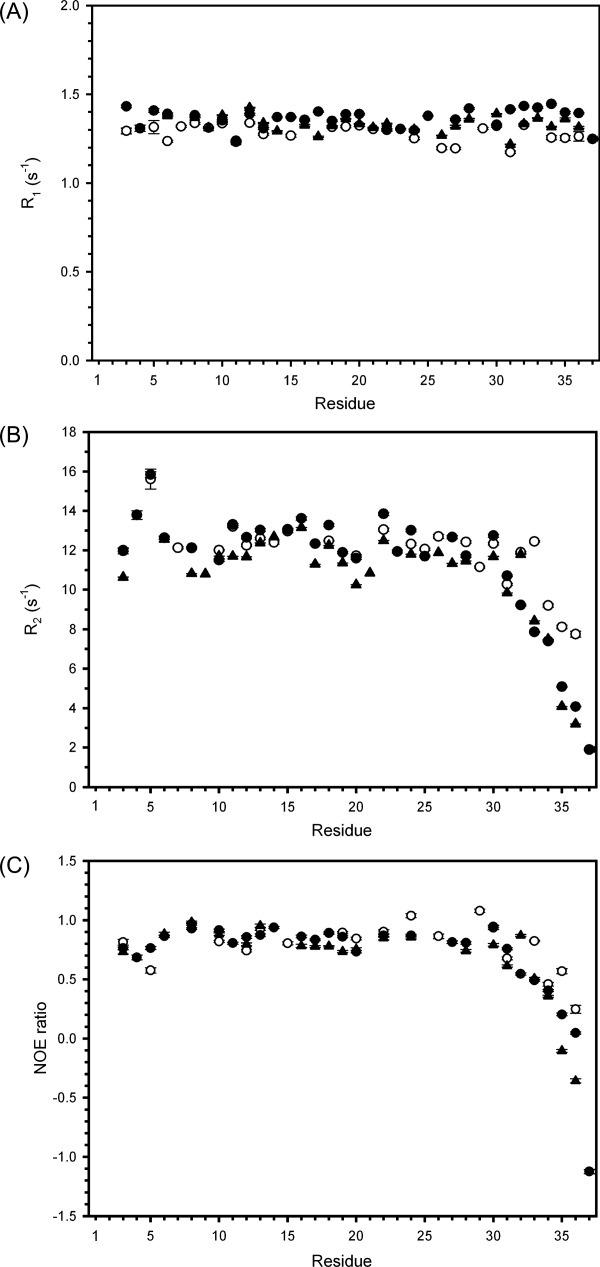
Figure 4.

Relaxation data of rHPLC6 and mutants. The (A) R1, (B) R2, and (C) 15N-NOE data are plotted on a per residue basis. Error bars represent the error in fitting the relaxation decay curves as described in CCPNMR. rHPLC6, open circle; rHPLC6-Ala37-NH2, open triangle; rHPLC6-Arg37, solid circle; rHPLC6-Ala37, solid triangle.
