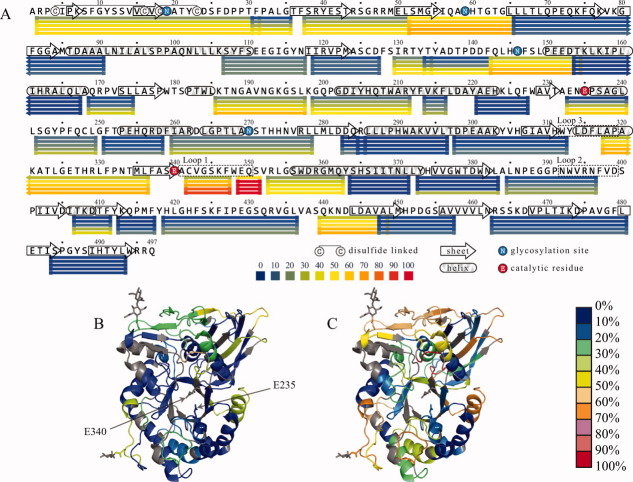
Figure 3.
Protection of peptide fragments of GCase at pH 4.5 revealed by HDX-MS data plotted to the protein sequence (A) and HDX protection data for 0.5 (B) and 60 min (C) mapped to the crystal structure of the protein. Peptic fragments (excluding their respective N-terminal amino acids) are shown as horizontal bars below the sequence in Panel A and are colored according to the fraction of exchanged backbone amide hydrogen atoms. Each row of bars represents data collected at a designated time point (0.5, 5, 15, 60, and 120 min from top to bottom). The two active sites of glutamic acid residues are indicated in Panel B. Black-colored protein segments in Panels B and C indicate regions for which the HDX-MS data are not available.

