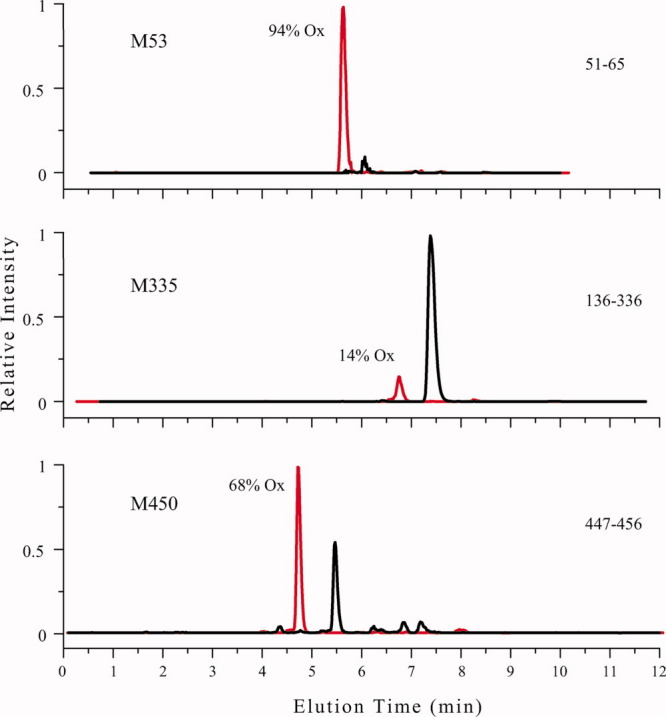
Figure 4.

Extracted ion chromatograms for a peptic digest of GCase-ox used to quantitate the extent of oxidation for the indicated residues. Data are plotted red for the oxidized species and black for nonoxidized species. Each panel is labeled by the peptic fragment used, the site of oxidation, and the percentage oxidation calculated for each residue.
