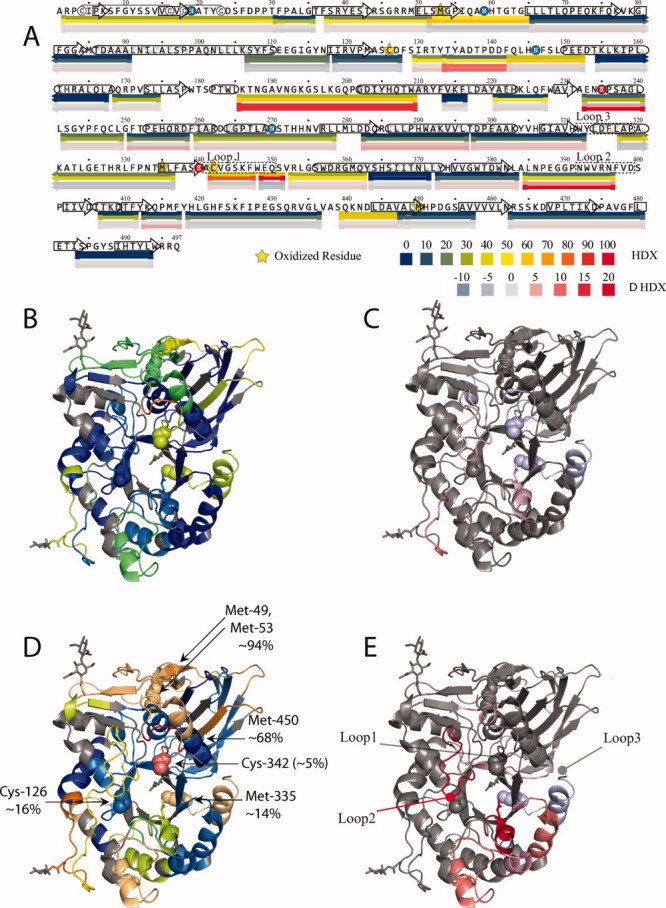
Figure 6.

Local backbone amide protection deduced from HDX-MS measurements mapped to the protein sequence (A) and the structure (B–E) are colored based on HDX (upper color legend) or ΔHDX (difference between oxidized and intact forms of GCase, lower color legend). The four bars in each row represent the following (from top to bottom): HDX 1 min (mapped to Structure B); HDX 100 min (mapped to Structure D); ΔHDX 1 min (mapped to Structure C); and ΔHDX 100 min (mapped to Structure E).
