
Figure 2.
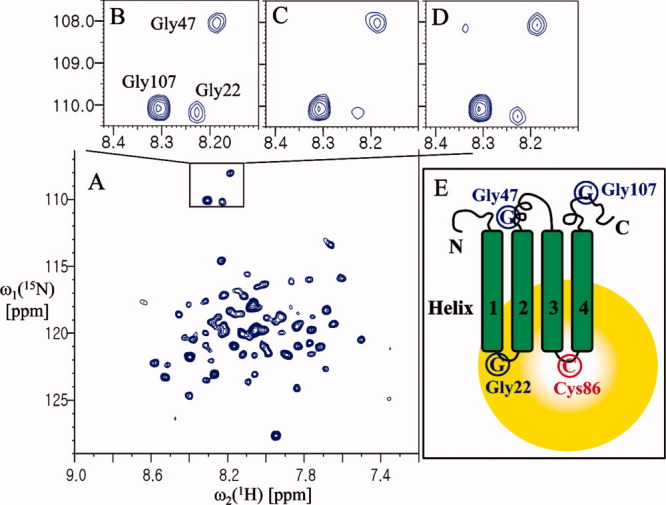
Analysis of the folding topology of Mistic. (A) The 2D 1H-15N TROSY spectrum of Mistic (Cys3Gly and Lys86Cys) at 37°C in 20 mM Bis-tris pH 6.0, ∼30 mM LDAO, and 2 mM DTT. (B) The 1H-15N correlation peaks of Gly22, Gly47, and Gly107 of the protein before spin-labeling. (C) The 1H-15N correlation peaks of the glycine residues of the spin-labeled protein. (D) The same sample as in (A), after incubation with 20 mM DTT for 1 h at 37°C. (E) Schematic representation of the folding topology of Mistic. The peak intensities of Gly22 were measured relative to a reference peak that was not affected by paramagnetic perturbation (at 8.26 and 123.05 ppm for the 1HN and 15N chemical shifts, respectively). The resulting values were: B, 0.33; C, 0.19; and D, 0.26.