
Figure 3.
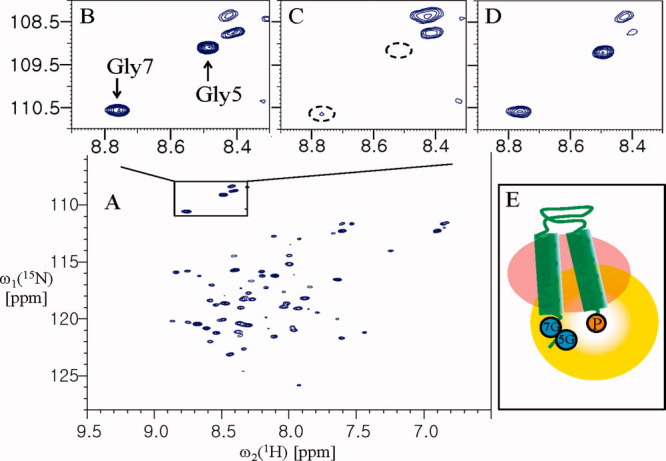
Analysis of the folding topology of YbdK-TM. (A) The 2D 1H-15N HSQC spectrum of YbdK-TM(Ser73Cys) at 40°C in 20 mM sodium acetate pH 4.8, ∼70 mM DPC, and 2 mM DTT. (B) The 1H-15N correlation peaks of Gly5 and Gly7 before spin-labeling. (C) The 1H-15N correlation peaks of the glycine residues of the spin-labeled protein. (D) The same sample as for (C) but after incubation with 20 mM DTT for 2 h at room temperature. (E) A possible model of the folding topology of YbdK-TM, if YbdK-TM is monomer in DPC micelles. The 5G and 7G (in the blue circles) and P (in the yellow circle) represent residues Gly5 and Gly7, and the paramagnetic probe at Cys73 position, respectively. The peak intensities of Gly7 were measured relative to a reference peak that was not affected by paramagnetic perturbation (at 8.11 and 112.74 ppm for the 1HN and 15N chemical shifts, respectively). The resulting values were as follows: B, 3.20; C, 0.32; and D, 2.54.