
Figure 6.
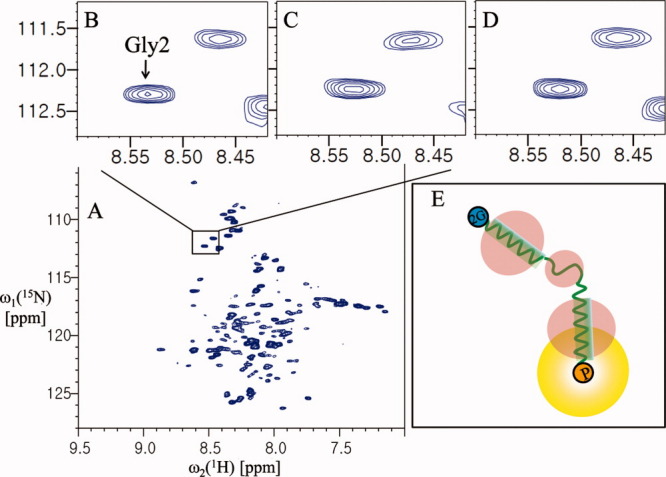
Analysis of the folding topology of SCO3062-TM. (A) The 2D 1H-15N TROSY spectrum of 0.4 mM SCO3062-TM in 20 mM sodium acetate pH 4.0, ∼70 mM DPC, and 2 mM DTT. (B) The 1H-15N correlation peaks of Gly2 before spin-labeling. (C) The 1H-15N correlation peaks of the glycine residue of the spin-labeled protein. (D) The same sample as for (C) but after incubation with 20 mM DTT for 2 h at room temperature. (E) A model of the folding topology of SCO3062-TM in DPC micelles. 2G (in the blue circles) and P (in the yellow circles) represent Gly2 and the paramagnetic probe at Cys146 position, respectively. The peak intensities of Gly2 were measured relative to a reference peak that was not affected by paramagnetic perturbation (at 8.35 and 111.40 ppm for the 1HN and 15N chemical shifts, respectively). The resulting values were as follows: B, 0.66; C, 0.66; and D, 0.64.