
Figure 3.
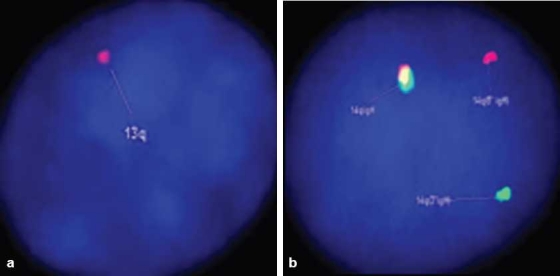
(a) Interphase FISH analysis showing loss of one copy of chromosome 13/13q, indicated by presence of single red signal (arrow). LSI D13S319 DNA probe hybridizes to the band 13q14.3 (red signal) (DAPI counterstain, ×1000). (b) Interphase FISH analysis showing 1red– 1green– 1yellow fusion signal pattern; as compared to the normal cells with a pattern of 0red– 0green– 2yellow (not shown). The splitting of yellow signal into 1red and 1green indicates translocation involving chromosome 14q32 (IgH region) (DAPI counterstain, ×1000)