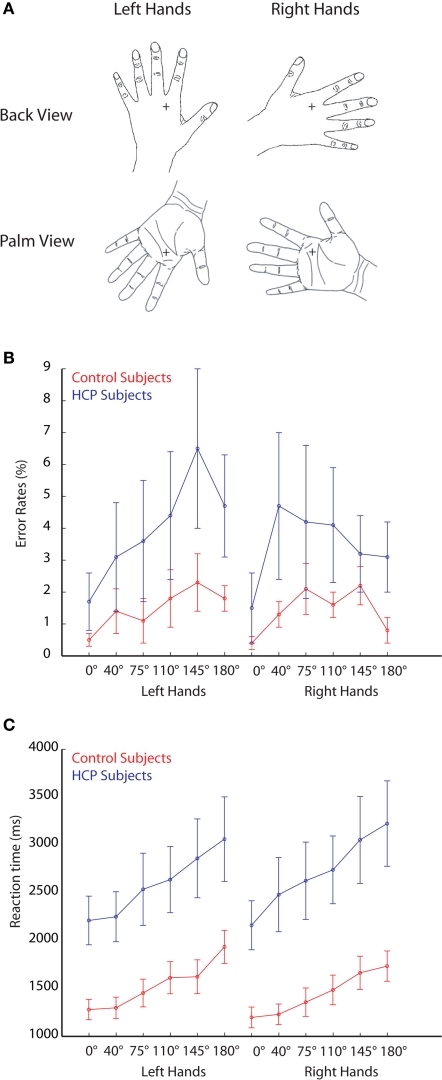
Figure 1.
Stimuli and behavioral performance. (A) Example stimuli used in the experiment representing left and right hands. (B) Error rates during the mental rotation of hand stimuli for control participants (red lines) and HCP participants (blue lines). (C) Reaction times during the mental rotation of hand stimuli for control participants (red lines) and HCP participants (blue lines). Error bars represent standard errors.

