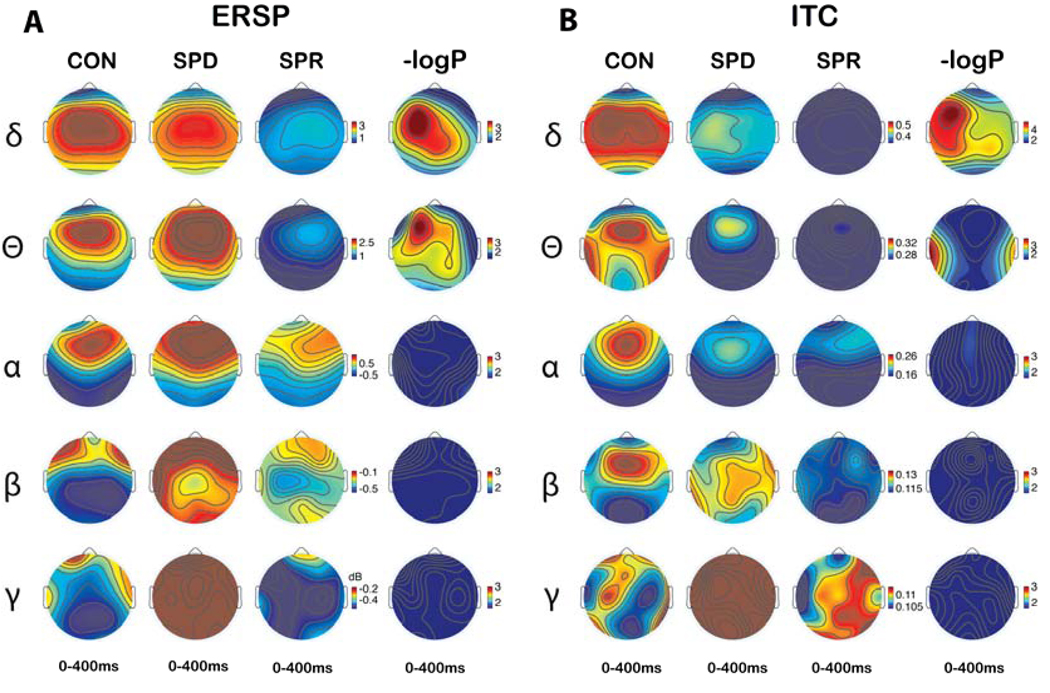
Figure 2.
Time frequency spectrogram topography of the averaged event-related spectral perturbation (ERSP) (A) and inter-trial coherence (ITC) (B) during 0 to 400 ms. The 4th and 8th Columns represent statistical topographies of −log10(P) values for comparisons among three groups of averaged ERSP and ITC during 0–400ms, respectively. The −log10(P) value in which P corresponds to FDR corrected q=0.05 was used for the threshold of the color maps. A lack of a significant difference on the FDR test is indicated by dark blue on the maps. All other colors indicate significant differences.

