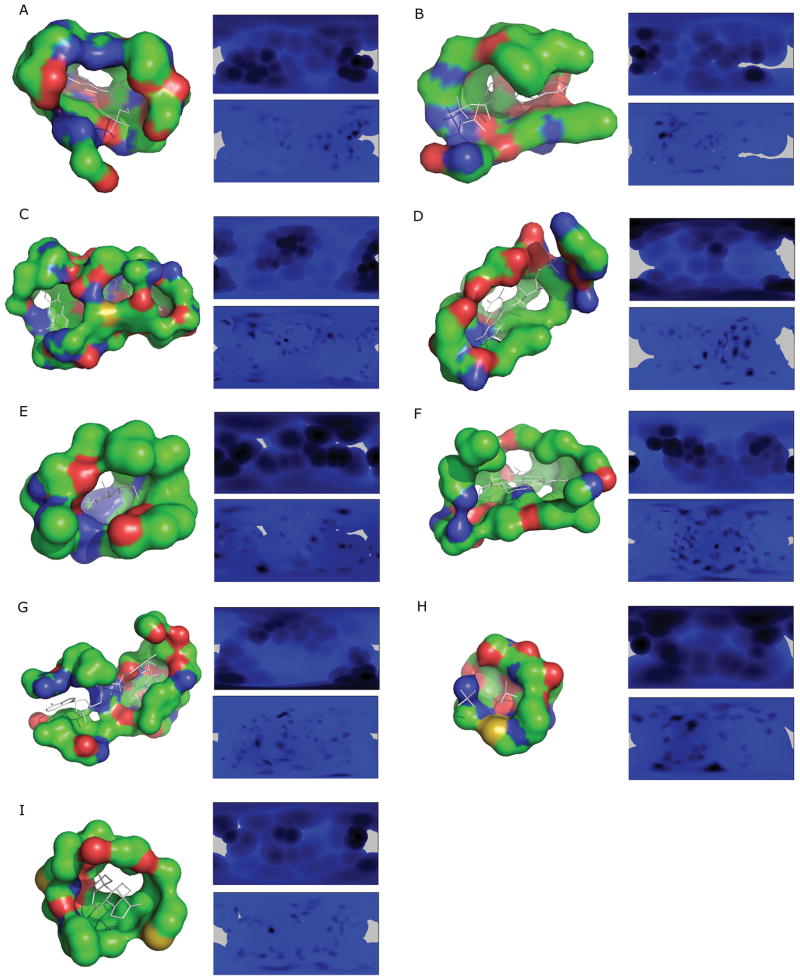
Figure 2.
Examples of the binding pocket representation by the 2D pocket model. The ligand binding pocket of a protein is sphere-mapped from its center of gravity and projected to a two dimensional plane. Blue to black colors indicate the Euclidean distance from the center to the pocket surface of that direction, and purple shows aperture. A, AMP binding site of 12AS; B, 1ESQ (ATP); C, 1HSK (FAD); D, 1P4M (FMN); E, 1K1W (GLC); F, 1NP4 (HEM); G, 1OG3 (NAD); H, 1GYP (PO4); I, 1E3R (STR).

