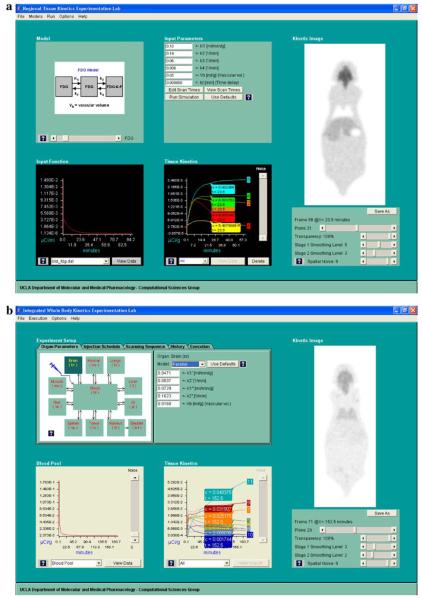
Fig. 4.
(a) Screen capture of the regional kinetics simulation window of the “Virtual Experimentation” module that allows user selection of model configuration (including values of the model parameters), input function, and imaging parameters. The simulated kinetics shown in the lower middle panel can be assigned to different organs of the digital mouse phantom to give a set of dynamic mouse PET images (shown in the kinetic images panel). (b) Screen capture of the whole-body kinetics simulation window of the “Virtual Experimentation” module, after a virtual experiment has been executed. The resulting blood TAC is shown in lower left; the TACs of other organ tissues are in the lower middle panel. The corresponding dynamic MicroPET image are shown on the right-hand side of the figure.

