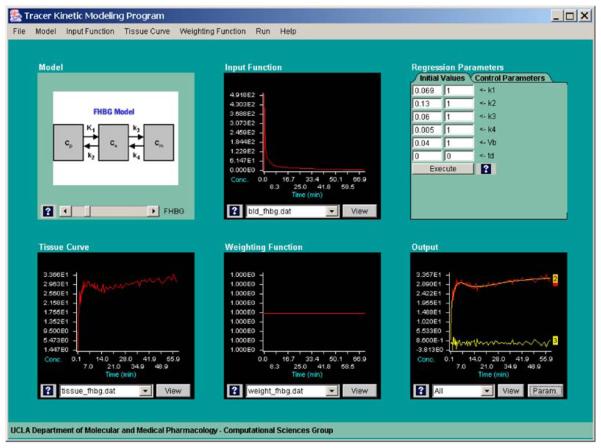
Fig. 6.
A screen capture of the “Model Fitting” module. The user can evaluate a particular model to fit a measured/simulated tissue TAC with a corresponding input function. Data weighting, parameters to be adjusted, and initial parameter values can be selected by the user, and the quality of the fitting results (including the residuals of the fit) is statistically evaluated and graphically displayed.

