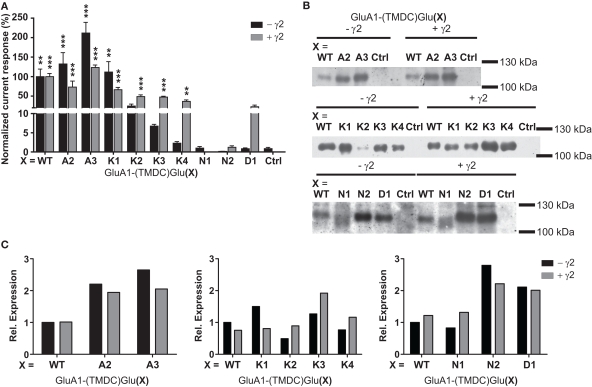
Figure 3.
(A) Kainate-induced current amplitudes of TMD C chimeras in the absence and presence of γ2. Currents were normalized to the wild type; error bars show the SEM. Asterisks represent significant differences to controls (uninjected or γ2-injected oocytes, respectively). **p > 0.01, ***p > 0.001, one-way ANOVA with Dunnett's post test. (B) Western blot analysis of expression of the TMD C chimeras. All constructs are detectable in the membrane fraction, independently of TARP expression. However, GluA1(TMDC)GluK2 is only weakly present in the absence of γ2, and GluA1(TMDC)GluN1 exhibits band broadening. Ctrl, controls injected with water. (C) Densitometric quantification of the Western blots shown in (B). Since the membrane protein preparations were performed in three different batches of oocytes, band intensities were normalized to GluA1 wild type in absence of γ2 for each batch.

