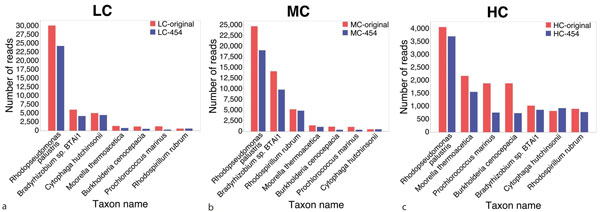
Figure 3.
Assignment of Roche-454 reads to taxa. Blue bars indicate how many Roche-454 reads were assigned to seven different taxa, for each of the synthetic datasets LC (a), MC (b) and HC (c). Red bars indicate how many Roche-454 reads were actually simulated for each of the taxa. For ease of comparison, we have normalized the counts to a total of 100,000.

