
Figure 3.
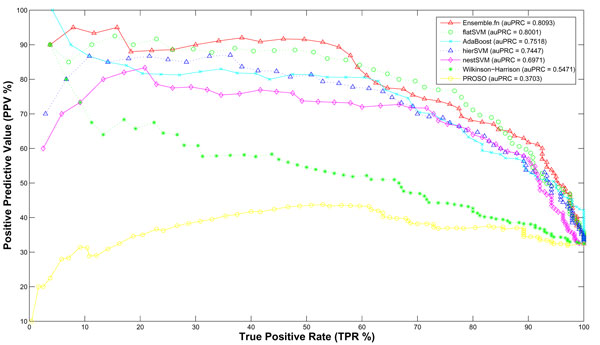
Comparative analysis with PRC curves. The PRC Curves from the comparative analysis of solubility prediction methods.
Official websites use .gov
A
.gov website belongs to an official
government organization in the United States.
Secure .gov websites use HTTPS
A lock (
) or https:// means you've safely
connected to the .gov website. Share sensitive
information only on official, secure websites.
Comparative analysis with PRC curves. The PRC Curves from the comparative analysis of solubility prediction methods.