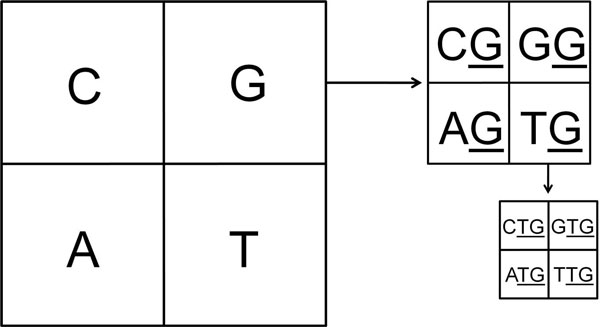
Figure 1.
Schematic explaining Chaos Game Representation. The division of CGR to obtain dinucleotide and trinucleotide frequencies with the G quadrant shown sub-divided into the corresponding G-ending dinucleotides. The first letter is arranged following the pattern of single nucleotide used to plot the CGR, with G, C, A and T given from first to fourth quadrant respectively.

