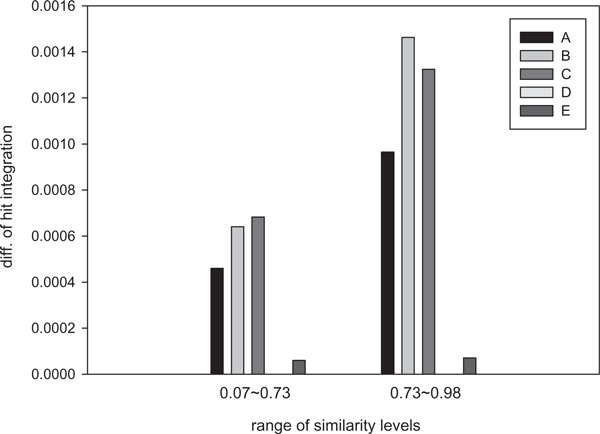
Figure 3.
The comparison of quantitative differences. The quantitative differences of hit integrations for five dominant seeds are compared each other: A: 111*1**11*1*1**111, B: 111*1*1**11*1**111, C: 111*11**1*1**1*111, D: 11**111*1**1*111*1, and E: 1111*1*11**1***111. The value of seed D is set to be 0 because it showed the lowest probability at all ranges. The values of the others are subtracted by the value of the seed D.

