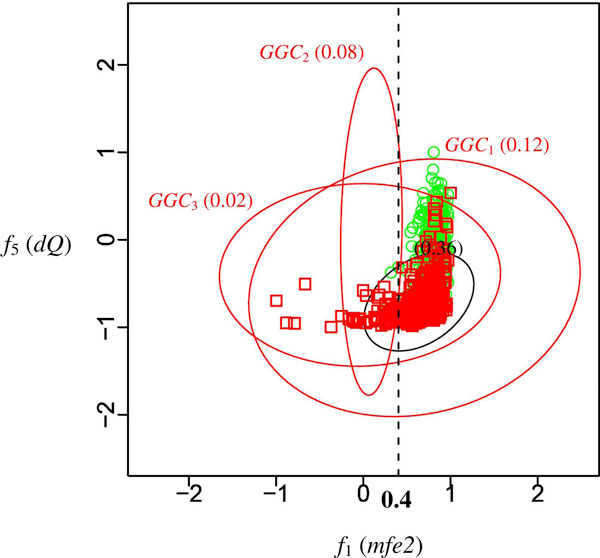
Figure 3.
Distribution of the HU920 dataset. The x-axis is the first feature of the second feature set, ratio of MFE to the number of stems; the y-axis is the fifth feature of the second feature set, adjusted Shannon entropy. Red ellipses represent the generalized Gaussian components shown in Figure 1; the black ellipse represents the Gaussian component shown in Figure 2. The red squares and green circles represent the pre-miRNAs and the pseudo hairpins, respectively. Values within the parentheses indicate the correlations between these two features in the corresponding Gaussian components.

