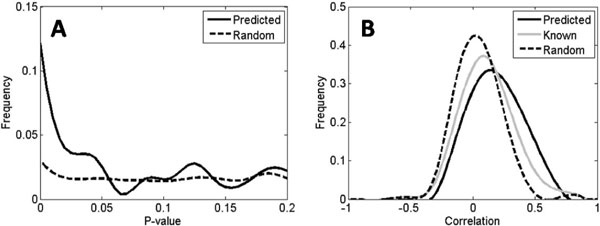
Figure 4.

Validation of the genome-wide regulatory predictions with external resources. (A) P-value distributions of ChIP-chip binding dataset for predicted regulatory pairs and randomly selected pairs. (B) Correlation coefficient distributions in the growth fitness dataset for known co-regulated TGs, predicted regulatory pairs and random pairs. The three distributions shown in (B) represent the correlation of growth fitness between a known TG (gray), a predicted TG (solid black), and a randomly selected non-TG vs. the centroid of the known TGs of a TF (dashed black).
