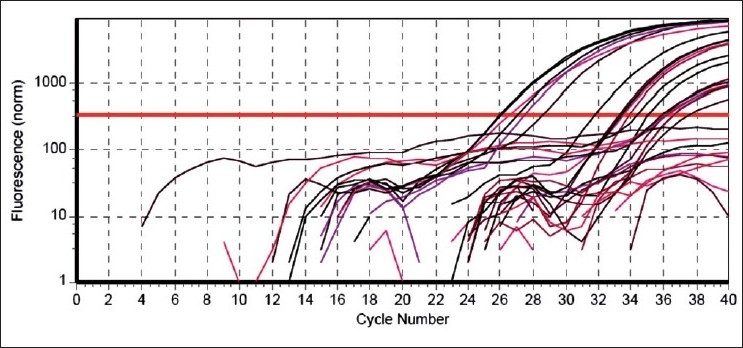
Figure 1.

Real-time PCR amplification plot for SRY gene. The horizontal red line indicates the threshold value of fluorescence. All the samples positive for SRY gene show amplification of the target sequence that attains the threshold fluorescence at varying cycles of amplification. Those samples negative for the SRY gene show the fluorescence to be below the threshold value (red line)
