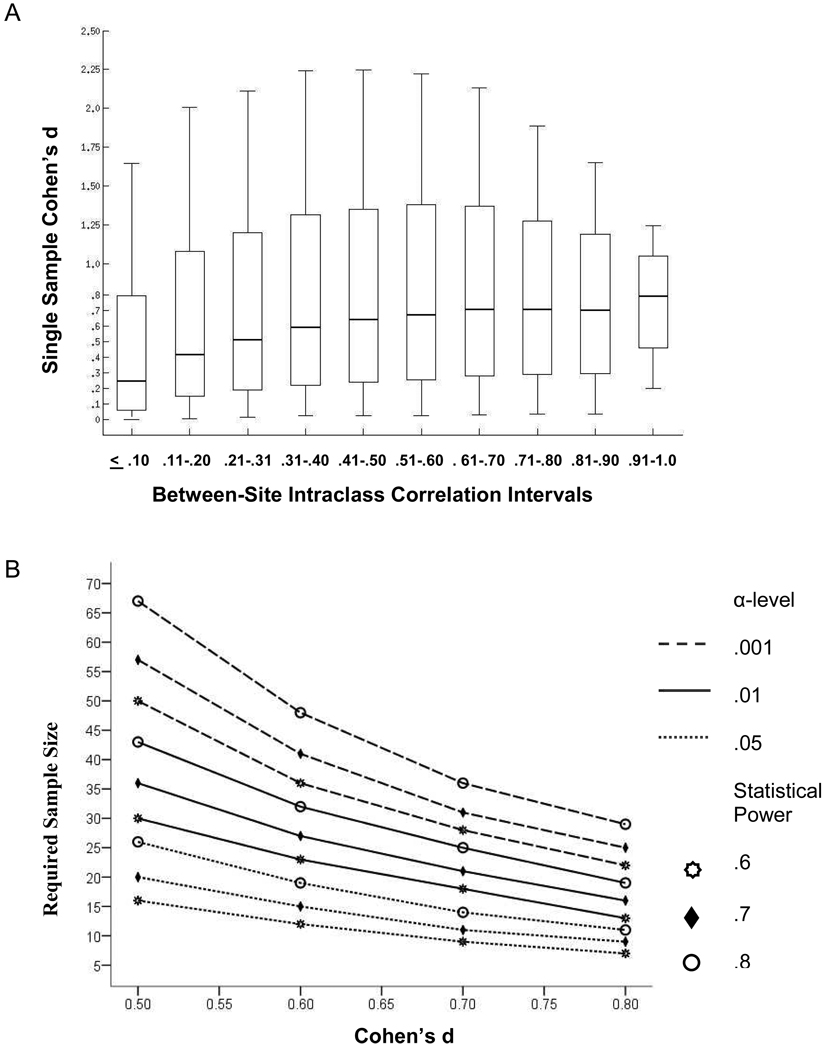
Figure 5.
(A). Effect size (Cohen’s d) by binned intervals of between-site reliability. The effect size value was derived from the single-sample t-test comparing recognition probes with scrambled pictures. The between-site reliability values were obtained from the eight-run between-site reliability maps. See Figure 3A. (B) Sample sizes required to detect a significant effect for a one-tailed test at three α-levels and three levels of power for medium to large effect sizes (Cohen’s d .5 to .8).

