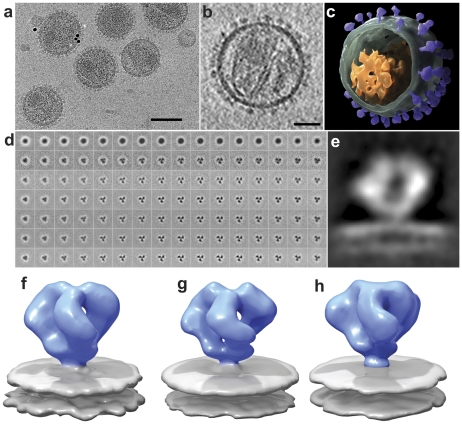
Figure 1. Cryo-electron tomography and molecular architecture of trimeric SIV Env.
(a) Low-dose (12 electrons/Å2) projection image recorded from purified SIVmneE11S virions plunge-frozen directly in physiological buffer. The dark spots are 10 nm-sized gold particles that serve as fiducial markers for tilt series alignment. (b) Slice through reconstructed cryo-electron tomograms of a single SIVmneE11S virus. The image was obtained by averaging 6 slices from a 4×4 binned tomogram and is ∼10 nm thick. The viral core and surface spikes can be clearly visualized in the image. (c) 3D rendering of the virion shown in (b), segmented to highlight the viral membrane (green), core (orange) and abundant surface spikes (purple). (d) Results from classification and 3D averaging of ∼4000 3D volumes of SIVmneE11S showing improvement from the first round (second row), to the final round (bottom row) of image classification (see Figure S2 for expanded version of this figure panel). Early stages of classification clearly show classes with inherent 3-fold symmetry, and typically at the fourth iteration, 3-fold symmetry was imposed. At the end of each iteration, the classes that showed the most clearly delineated features in all regions of the spike were selected and combined for use as a reference for the next round. The progression of images from left to right represent successive slices (4.1 Å thickness) from bottom to top of Env through the density map of averaged classes that was used as a reference for the next iteration. The subset of slices shown spans a region of ∼65 Å between the gp120/gp41 interface to the apex of gp120. (e) 2D density profile from a slice through the density map for SIVmneE11S derived from classification and 3D averaging of ∼4000 spikes. (f-h) Perspective views of density maps for SIVmneE11S (f), SIVmac239 (g) and HIV-1 BaL (h) Env shown as isosurface representations with envelope glycoprotein ectodomain shown in blue and viral membrane shown in gray. Scale bars are 100 nm in panel (a) and 35 nm in panel (b).

