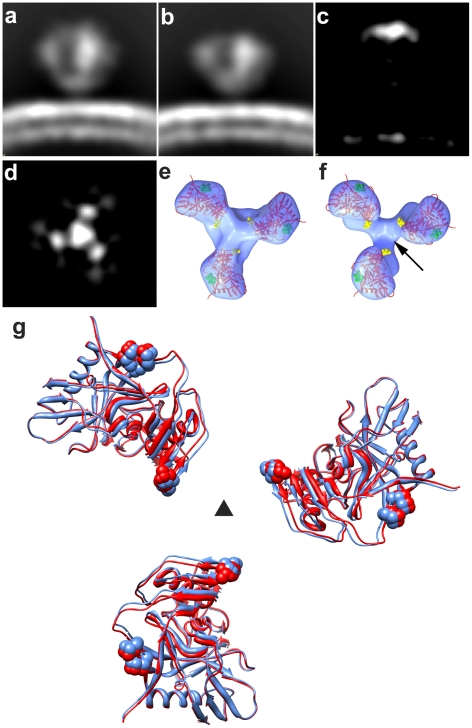
Figure 2. Structural analysis of full-length and V1/V2 loop-deleted HIV-1 R3A trimeric Env.
(a, b) Side view of raw density projections for full-length trimeric HIV-1 R3A Env (a) and the V1/V2-loop deleted HIV-1 R3A mutant (b) showing the loss of density at the apex in the mutant. This is confirmed by location of the peak in the difference density projections between full-length and loop deleted Env (c, d), shown both as a side view (c) and as a top view (d). (e, f) Top views of fitted density maps rendered as isosurfaces for wild-type and V1/V2 loop-deleted mutants, respectively, of the HIV-1 R3A strain. The gp120 coordinates (1GC1) are shown as red ribbons and were fitted using automated procedures into the density maps. The black arrow in (f) points to the location of the missing density in the V1/V2 loop-deleted variant, and residues in stump of the V1/V2 and V3 loops in the coordinates are highlighted in yellow and in green spheres, respectively. (g) Superposition of fitted coordinates for the gp120 trimer in the full-length and V1/V2 loop-deleted viruses with fits to the wild-type map in red and the mutant in blue, with the black triangle representing the 3-fold symmetry axis.

