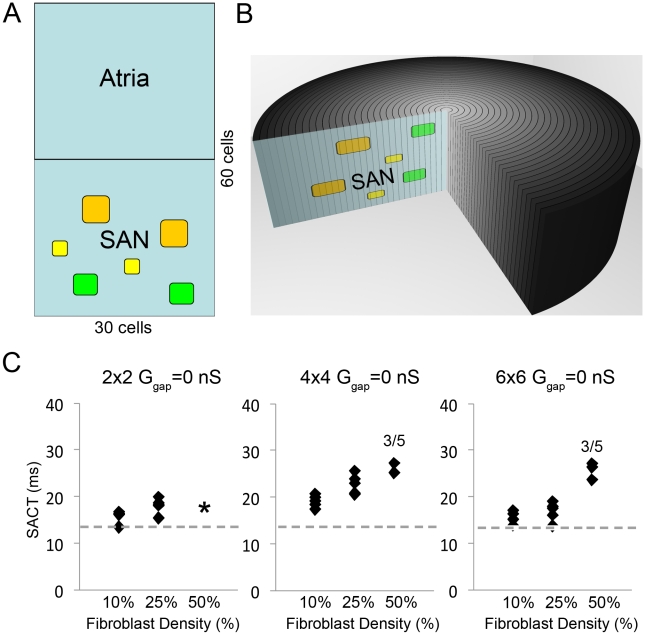
Figure 4. The effect of fibroblasts in the SAN.
A and B: Schematic of a 3D tissue and 2D slice incorporating different sized islands of fibroblasts: 2×2 (yellow), 4×4 (green) and 6×6 (orange) within the SAN region. Panel C: Uncoupled fibroblasts and myocytes act as obstacles to electrical impulse propagation. For fibroblast-myocyte coupling of 0nS (Ggap = 0 nS), as fibroblasts percentage coverage increases sinoatrial node to atrium conduction time (SACT) increases for all islands sizes (left - 2×2, middle - 4×4, right - 6×6) and distributions (see Figure 3 in Text S1 for all distribution maps). Each fibroblast density (10%, 25% or 50%) is represented by 5 distributions (black diamonds). The dashed gray line denotes the SACT control value (13.8 ms).

