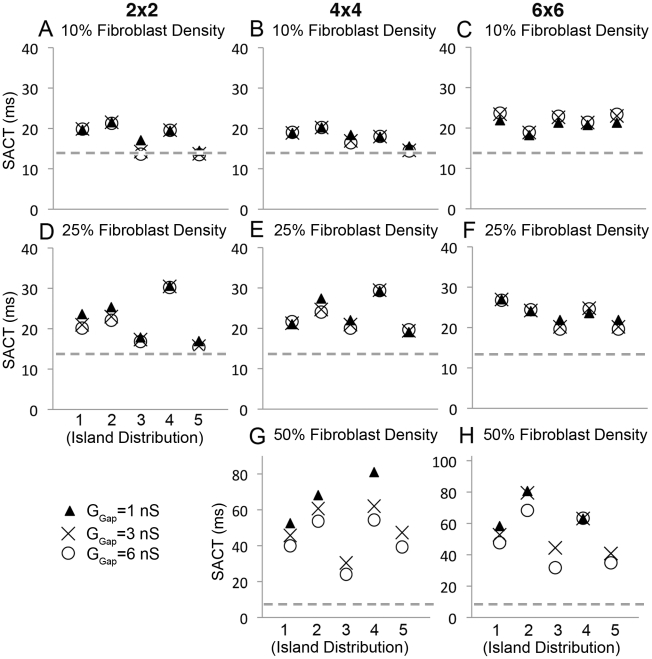
Figure 5. Modulation of sinoatrial node to atrium conduction time (SACT) by fibroblasts is shown.
Panels show effects of different fibroblast spatial distributions, island sizes, fibroblast density and fibroblast-myocyte coupling values (Ggap). In each panel, Ggap is 1 nS (triangle), 3 nS (X) or 6 nS (circle). A–C) 10% coverage - neither island distribution nor coupling affect SACT. D–F) 25% coverage - island distribution does affect SACT (see text). G–H) 50% coverage - both island distribution and coupling affect SACT. The dashed gray line denotes the value of SACT (13.8 ms) without fibroblasts.

