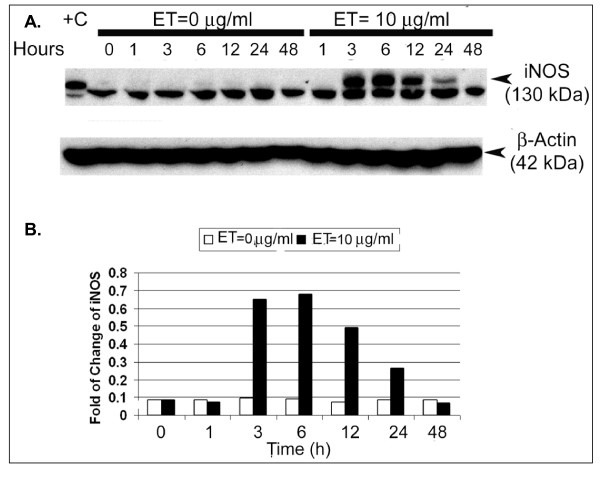
Figure 2.
ET-induced expression of iNOS protein in SCp2 cells. Western immunoblots of total cellular protein extracts were probed for (A) iNOS with expected molecular weight of 130 kDa (specific bands indicated by arrow). (B) Densitometric analysis was done using NIH Image J program. The fold change of the intensity of the 130 KDa band relative to that of β-actin housekeeping gene expression was plotted over time post-ET treatment. Bovine aortic endothelial cell (BAEC) total protein extract were included as positive control (+C) for iNOS. Equal loading of proteins was verified by probing for 42 kDa β-actin. Each lane represents one sample at a particular time point. This experiment was repeated three independent times and densitometric analysis shown was performed on one of the blots as representative of the magnitude of change noted across the three experiments.

