Figure 6.
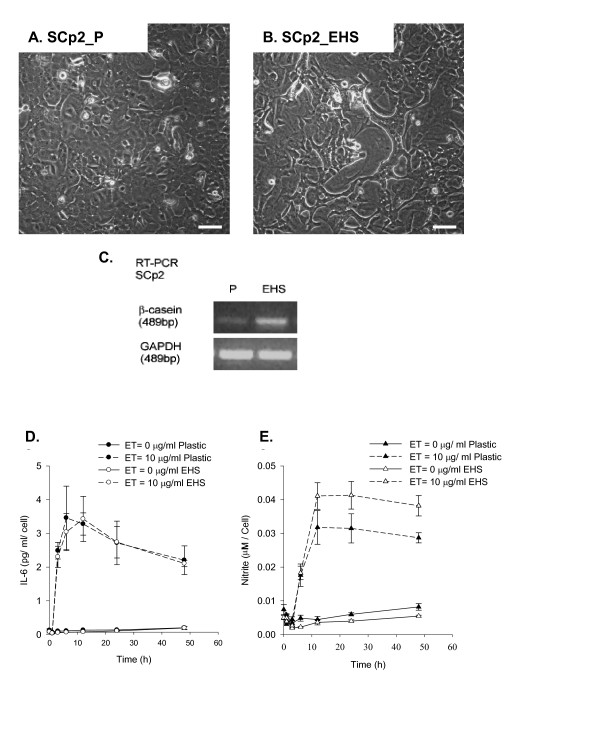
The effect of EHS on SCp2 cell differentiation and their response to ET. Phase contrast photomicrographs (40×, Bar = 50 μm) of SCp2 cells (plated at 4 × 10⁴ cell/cm2) on day 3 of culture on (A) plastic (SCp2_P), or (B) in the presence of EHS (SCp2_EHS). (C) Expression of β-casein assayed by RT-PCR. GAPDH PCR product was used as a normalizing control. (D & E) SCp2 cells were plated as described in Methods. The medium was collected and assayed for (D) IL-6 secretion (pg/ml) and (E) nitrite production (μM) normalized to cell number. Open symbols depicts the presence of EHS. Dashed lines depict the ET treatment. Data represents the average for triplicate samples ± SD of a representative experiment.

