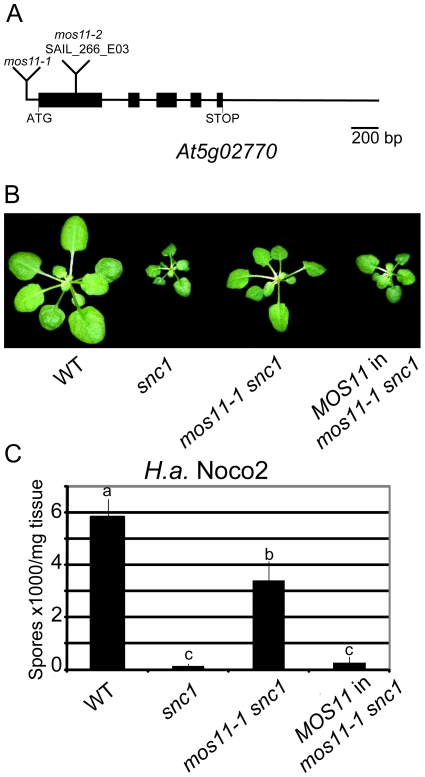
Figure 2. Complementation of mos11-1 snc1 by At5g02770.
(A) Gene structure of At5g02770. Exons are represented by black boxes and introns and UTRs are shown as solid lines. Locations of mos11-1 and mos11-2 (SAIL_266_E03) insertions are as indicated. (B) Morphology of WT, snc1, mos11-1 snc1 and a representative transgenic line with MOS11 (At5g02770) driven by its own promoter transformed into mos11-1 snc1. (C) Growth of H.a. Noco2 on WT, snc1, mos11-1 snc1 and MOS11 in mos11-1 snc1. The infection was carried out as in Figure 1E. Data were analyzed using one-way ANOVA. Different letters indicate statistically significant differences (p-value <0.001).

