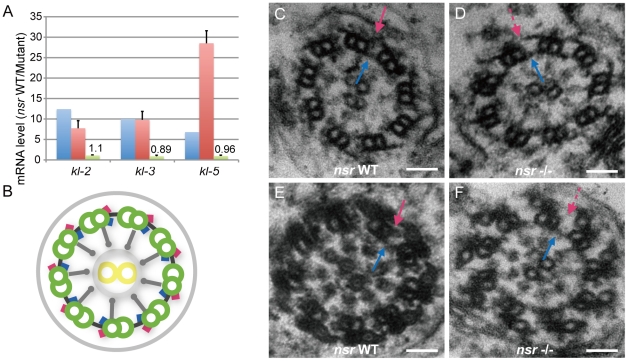
Figure 5. Identification of the Y chromosome genes kl-2, kl-3, and kl-5 as downstream targets of nsr.
(A) Histogram of kl-2, kl-3, and kl-5 RNA level changes in testes of nsr mutants for mature transcripts, estimated by RNA-Seq (blue) and quantitative real-time PCR (red), and for primary transcripts estimated by quantitative real-time PCR (green). Error bars indicate standard deviation. Both RNA-Seq and real-time PCR results show that the mature transcripts are down-regulated in the mutant testes. The difference between the estimations of kl-5 by RNA-Seq and real-time PCR is possibly due to the larger variations of genes with lower abundance in RNA-Seq [62]. The real-time PCR result shows that the levels of primary transcripts are largely unaltered between the WT and mutant testes. (B) Graphic illustration of axoneme structure [63], [64]. The axoneme is composed of a central pair of singlet microtubules (yellow circle) surrounded by nine doublet microtubules (green circle), anchored by outer (red) and inner (blue) dynein arms that can mediate axoneme motility. Radical spokes (grey spoke) pass from each doublet fiber toward the central singlets. (C–F) Electron microscopic images of early- (C and D) and late-stage (E and F) spermatid axonemes for WT and nsr mutants. The late-stage axoneme is distinct from early-stage axoneme by extensive accessory structures. For both stages, the inner dynein arms of the axoneme are normal in nsr mutants (blue arrow), but the outer dynein arms (red arrow) are constantly missing (dashed red arrow). Scale bars: 50 nm.

