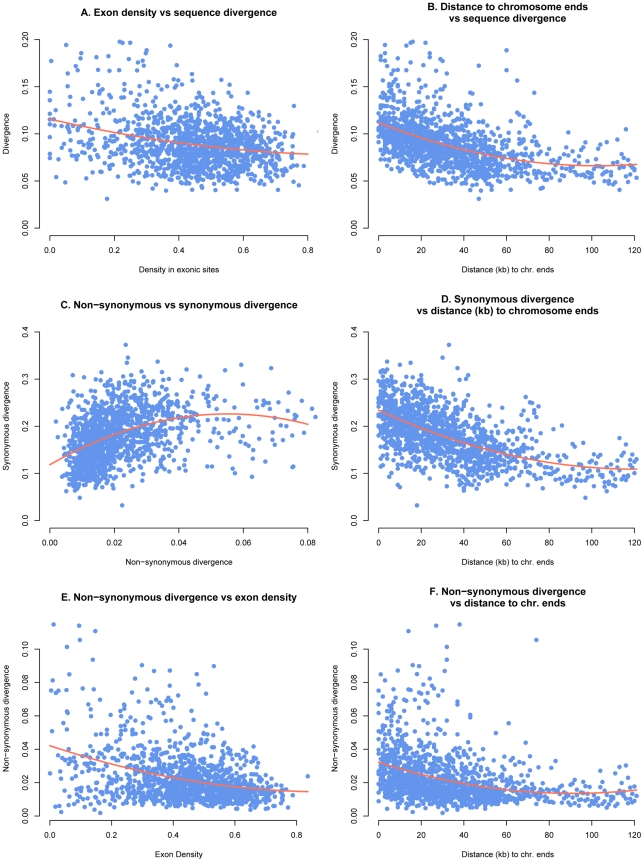
Figure 4. Genome parameters calculated in 25 kb windows and plotted with 2nd order polynomial regression curve.
A) Inter-genic substitution rate and exon density, B) inter-genic substitution rate and distance to telomeres, C) Ks and Ka, D) Ks and distance to telomeres, E) Ka and exon density, and F) Ka and distance to telomeres.

