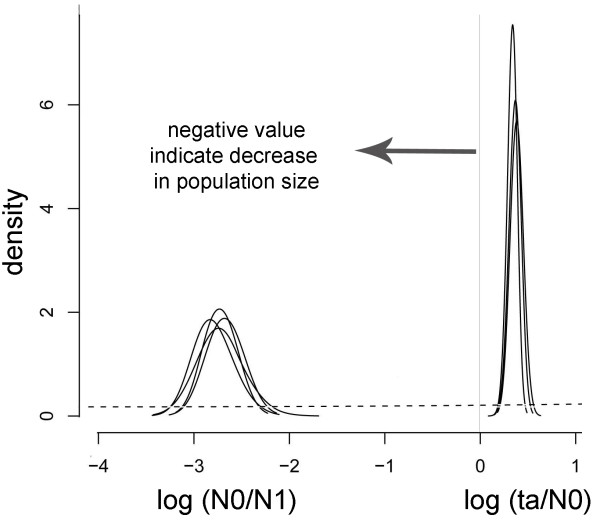
Figure 4.
Population size change. Posterior distributions of the demographic parameters on a logarithmic scale obtained with the Beaumont (1999) method: (r) = (N0/N1) represents the ratio of present (N0) to past (N1) population size; (tf) = (ta/N0) represents the ratio between the time in generations (ta) of the population change and the present population size (N0). Every solid line corresponds to a different run and the prior distribution is shown for comparison (flat dashed line).

