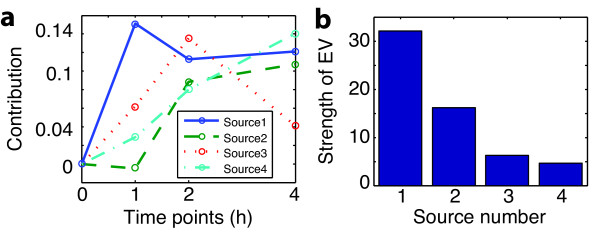
Figure 4.
Result of GraDe. This figure illustrates the decomposition of the time-course microarray experiment on IL-6 stimulated hepatocytes with GraDe. As underlying network we used interactions from the TRANSPATH database (see Methods). (a) shows the time-courses of the four extracted sources, centered to time point 0 h. The x-axis shows the measured time-points and the y-axis the contribution of the mixing matrix. In (b), we plot the strength of the eigenvalues (EV) of the resulting sources. All four extracted sources have significant contributions.

