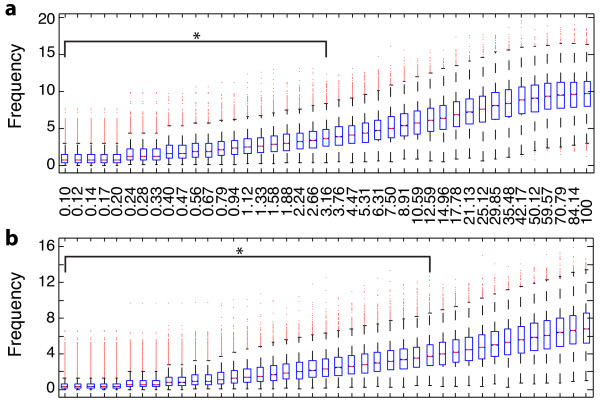
Figure 7.
Robustness analysis. Robustness analysis: We evaluated the robustness of GraDe against errors in the underlying graph. To this end, we compared the mixing matrix that we extracted with the TRANSPATH network with those obtained based on perturbed versions. For this comparison we use the Amari index (see Methods). The boxplots show Amari-indices obtained with (a) a network rewiring approach and (b) when adding random information to the network. The x-axis shows the amount of information randomized (in %), the y-axis gives the obtained Amari-index. * indicates significant 95% quantiles compared to a random sampling (p-value ≤ 0.05). We see that GraDe is robust against a reasonable amount of wrong information.

