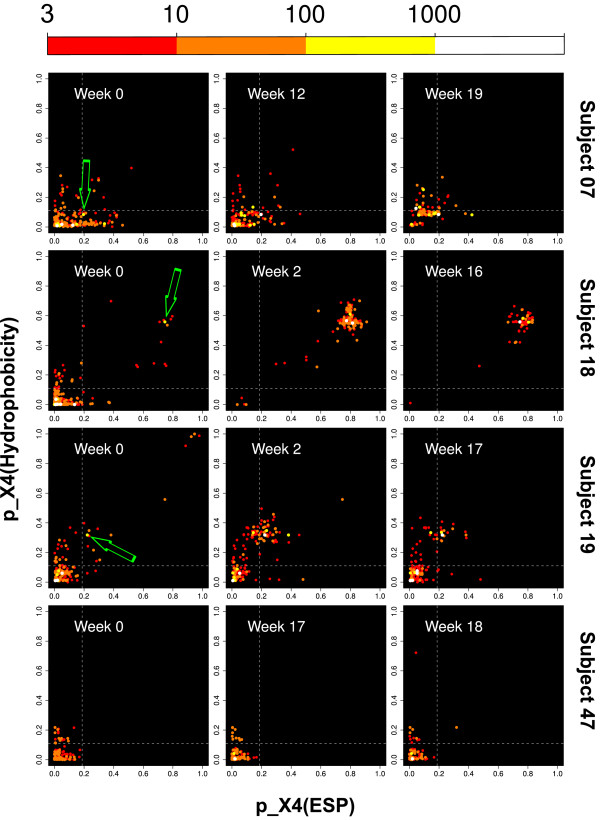
Figure 2.
Development of quasi-species. Development of HIV-1 quasi-species in patients. Every dot represents a combination of two tropism predictions for the same V3 sequence: one prediction based on electrostatic potential (ESP), the other on hydropathy. Colors code the number of reads (color legend in top line). Dashed lines distinguish between R5 and X4 classes of the first level predictors. Cutoffs were chosen at 90% specificity in the training set. Arrows mark X4 seed strains responsible for tropism switch.

