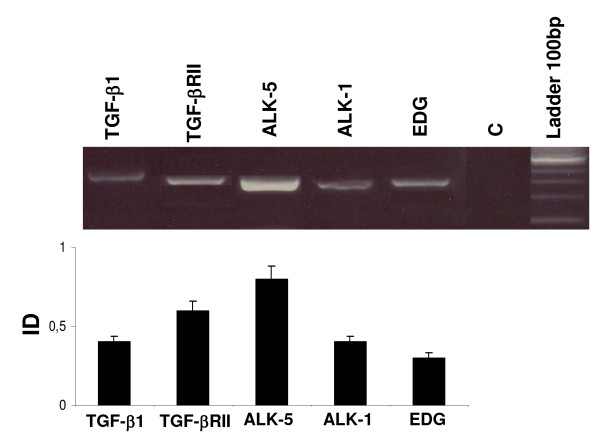
Figure 5.
Gene expression of TGF-β1, TGFBRII, ALK-5, ALK-1 and endoglin (EDG) in normal testicular tissue. Results are represented with an arbitrary scale and expressed as the ratios between the expressions of the specific gene and β-actin (integrated density, ID). Data are plotted as the mean ID ± SEM. Tukey's Multiple Comparisons were done between groups. Different letters indicate significant differences (p< 0.05)

