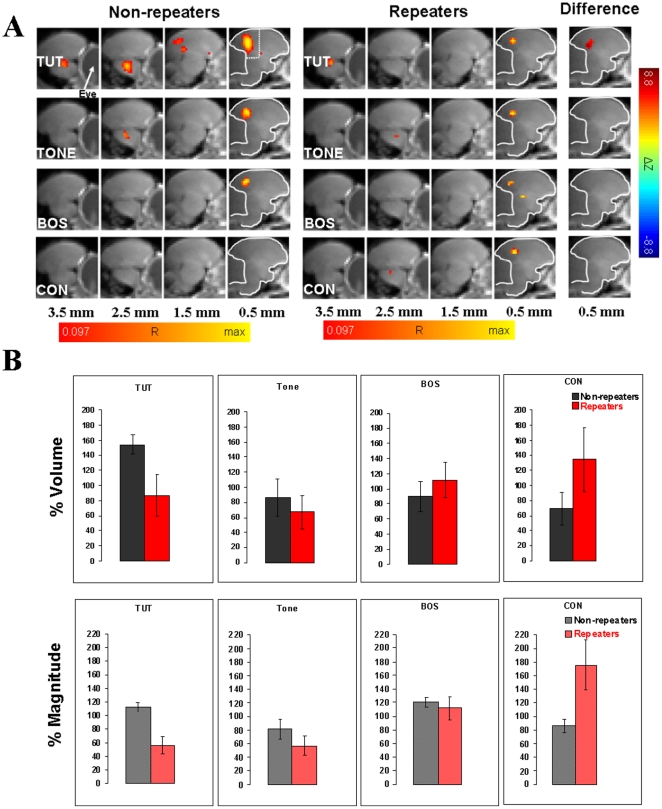
Figure 2. Functional MRI in syllable repeaters and non-repeaters.
A. BOLD activations averaged over 8 non-repeater birds (“non-repeaters”) and 8 birds with syllable repetitions (“repeaters”) for the four auditory stimuli, tutor's song (TUT), 2 kHz pure tone (TONE), bird's own song (BOS) and conspecific song (CON). The type of stimulus is indicated on the left of each panel. The distance of the slice midlines from the midline of the brain is shown at the bottom. For the next-to-midline slice, the outline of the cerebrum is indicated, and in the first set of images the region of interest is shown as the area between the dotted lines and the border of the cerebrum. In the images labeled “Non-repeaters” and “Repeaters”, colors denote correlation coefficients R, which are overlaid on corresponding anatomical brain MRI sections. In the images labeled “Difference” color corresponds to the difference in z-values (non-repeaters – repeaters). The red end of the color scale corresponds to R = 0.097 or ΔZ = −8.8 (each corresponding to p<10−6, multiple test corrected). The yellow end of the R color scale is scaled individually. Activations from the right and left hemispheres of the brain are averaged. The main activated area that is consistently activated in all images corresponds to L/CM/NCM region. Even though CON activates the auditory areas in all non-repeater birds, unlike repeaters, no activated voxels are seen in the averaged images of non-repeaters. This is most likely because there is less consistency in non-repeaters compared to repeaters in the precise location of activated voxels. In accordance with this, the difference image does not show significant differences. B. Comparison of the volume and magnitude of BOLD response in the medial posterior area containing field L and small portions of CM and NCM for TUT, TONE, BOS and CON stimuli in repeaters and non-repeaters. Comparisons of normalized data between non-repeater and repeater birds for each stimulus, corresponding to the shown bar plots, using Student's t test show statistically significant difference for TUT with respect to both % magnitude (p = 0.003, df = 7) and % volume (p = 0.05, df = 7). For CON the difference is significant with respect to % magnitude (p = 0.048, df = 7), but not with respect to % volume. The corresponding values for TONE (% magnitude – p = 0.27, df = 7; % volume – p = 0.56, df = 7) and BOS (% magnitude – p = 0.64, df = 7; % volume – p = 0.48, df = 7) are not significant at the 5% error probability level. The error bars in the figure represent SEMs. A two-way ANOVA on the (non-normalized) BOLD response magnitude data over both groups and stimuli gives for the stimuli p = 0.02 (F = 3.52), for the groups p = 0.24 (F = 1.41), and for the interaction p = 0.01 (F = 3.84). The corresponding values on the BOLD activation volume are p = 0.20 (F = 1.61), p = 0.37 (F = 0.82), and p = 0.47 (F = 0.85), respectively. Two-way ANOVA only makes sense if the data are not normalized because the within-bird normalization erases differences with respect to groups. These results are overall consistent with the non-parametric analysis on the non-normalized data shown in Figure 3.

