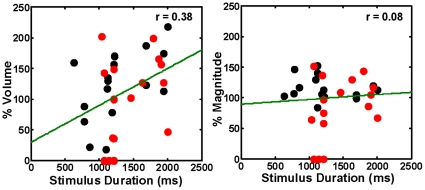
Figure 4. Absence of significant high correlation between the stimulus duration and BOLD response.
Plots of % volume and % magnitude of the BOLD response as a function of the song stimulus duration. The stimuli represented here are those that showed variable duration, namely BOS and TUT. The BOLD response does not show a significant high degree of systematic correlated change with the duration of the stimulus in repeaters (red dots) and in non-repeaters (black dots). The green lines depict linear fit to the data.

