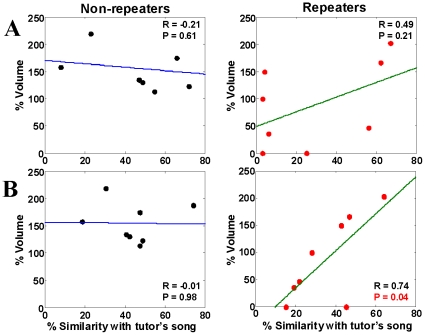
Figure 5. Correlation of BOLD response with tutor's song similarity.
The volume of response to TUT in non-repeaters and repeaters, expressed as a percentage of the mean of all stimuli in each bird, is plotted as a function of the % similarity of the pupil's song with that of its tutor. The % similarity values obtained with the asymmetric time course motif comparison method (A) using the Sound Analysis Pro program [25], [26] show no statistically significant correlation in repeaters (red dots) or non-repeaters (black dots); however, values obtained using the symmetric method (B) shows positive linear correlation in repeaters, but not in non-repeaters. Linear fit to the data is indicated by the blue and green lines.

