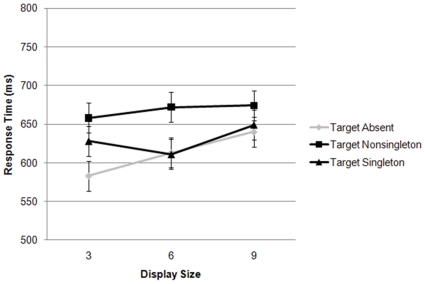
Figure 1. The response times for visual search for a right-tilted target bar among left-tilted nontargets (see Figure 4 panels A and B) as a function of display size for the target absent, target-present nonsingleton, and target-present singleton conditions are plotted.
Error bars in this and all RT plots are 95% confidence intervals, calculated according to Loftus and Masson [20].

